Studying Singapore's urbanization alongside temperature rise
Between 1948 and 2025, Singapore grew warmer as the mean surface air temperature rose by
an average of 0.25 °C per decade.[^1] That is double the global rate,
where temperatures increased by 0.12 °C per decade between 1951 and 2012.[^1]
I'm not a climate scientist, but I am a minor historian, and I'm more comfortable searching
archives and studying the past, so that we can look toward the future. As a Singaporean,
I'm familiar with how rapidly my country has urbanized since the 1950s — which coincides
with what many perceive as the Great Acceleration (though there are others who argue the
Great Acceleration began as far back as the Industrial Revolution over a century earlier).
The reclamation of Toa Payoh, turning a swamp into a residential area. Expanding our shores
to overcome our land scarcity. Kampongs replaced by HDB flats. Grass paved over by
concrete. The modernization of Singapore did not come cheap, and much of the cost was
nature.
Again, I'm not a climate scientist, and thus, I cannot confirm for sure that urbanization
caused Singapore to become hotter, but from what I can see, there seems to be a relation
between the two. I think there is something useful in examining the
trend that arises when placing the history of urbanization next to a chart of how the
temperature has changed over the decades. Sometimes, a historical observation can pick up
something that scientific studies might overlook. Additionally, I have also
studied some botanical data to try and validate the various articles regarding urban
trees and their cooling impact on Singapore. To be clear, I’m not a botanist. But I have
attempted to track how effective trees are at cooling Singapore, based on the data on
transpiration rates and temperature measurements conducted by other scholars.
+0.25°C/decade
Singapore, 1948–2025[^1]
+28%
land, from 581.5 km² in 1960 to 744.3 km² in 2025[^5]
4°C
Difference between Lim Chu Kang and Orchard Road on the same day[^23]
Live tracking
Hot spots and cold spots
Below are the temperatures, fetched live from the National Environment Agency's
island-wide weather station network at
data.gov.sg,
showing the gap between the warmest and coolest parts of Singapore in real time.[^4]
You can see that the difference can sometimes reach between 2 and 3 °C when comparing urban and vegetated areas.[^30]
For example, in 2023, the difference between Singapore's hottest and coolest stations had
a median of 2.2 °C. For over three-fifths of the year, the difference
hovered above 2 °C, a measurement I had Claude Code take across 6,893,129 readings
(measured per minute) from 17 stations.[^30] When comparing the East Coast Parkway
expressway against Pulau Ubin, which remains largely undeveloped to this day, ECP
was warmer 78% of the time.
Interestingly enough, the difference is a steady 2.2 to 2.3 °C between 9pm and 7am,
only for both temperatures to equalize. In fact, for a short time in the early afternoon, Pulau Ubin
appears to be hotter. Apparently, during the day, artificial ground stores the heat before
emitting it once night has fallen.
NEA station network
Loading…
—
Warmest station
—
—
Coolest station
—
—
Spread across the island
—
——Loading…
Hover over a dot for that NEA station's current measurement.
Timeline
A century of change: construction and climate
On the left, we have the history of Singapore's urbanization. On the right, we track the
temperature change throughout the 20th and 21st centuries.
History of Singapore's urbanizationLand km²YearTemperature °C
← swipe →
Data
Several Lines of Thought
When I began collecting data (or rather, asked Claude Code to implement the data as a live
tracker in this page), I discovered two different records. Since I'm a history guy, I wanted to
go as far back as 1900, but only Berkeley Earth's data was available (and goes all the way back
to the nineteenth century).[^3] The Berkeley Earth record also ends at 2020, which wouldn't
suit my purpose as I wanted a living app that constantly updates every year.
Fortunately, the data from Changi's climate station, which is the official temperature record
used by Singapore, is available online on data.gov.sg. However, this same national record only
begins in 1982,[^2] which leaves a gap of 82 years. So I'm combining both records to fill in
for each other. That said, you'll notice a difference of 0.4 °C between them in the
years they overlap. Apparently, Berkeley Earth's record is based on a regional field average,
whereas Changi climate station's is much more specific.
Loading data…
The station doesn't remain stationary
Singapore's climate station has constantly moved over the decades, and as you can see from
the historical record above, even the nation's land is continuously developing and building.
Consequently, the temperature measured will inevitably be entwined with local construction.
Heatmap
Hold up, let Singapore cook
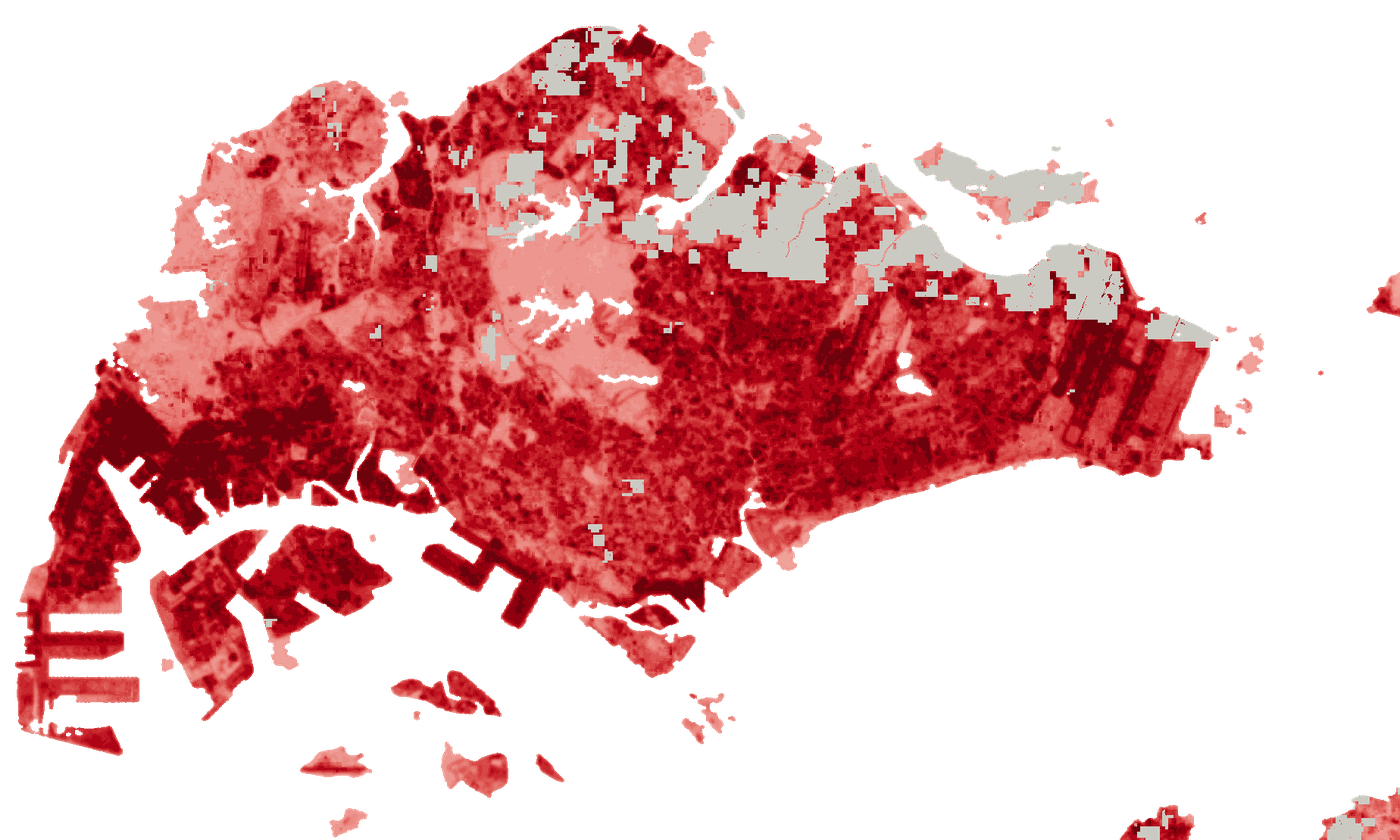
While NEA stations measure air temperature of specific sites in Singapore, this Landsat
collection focuses on surface temperature. That is to say, the temperature of the ground,
such as tarmac, roofs, or leaf canopy. Surface readings are usually higher than air
readings, which is why the numbers are much higher than the 28 °C annual mean
temperature in the timeline chart above. However, they are still important because they
display the heat distribution across Singapore, and as you study it, you'll be able to
notice a pattern.
The heatmap is built from thirteen cloud-free Landsat 8 and 9 passes over Singapore between
April 2022 and April 2026, each taken at about 11:16 a.m. Each pixel is 30 meters
across.[^39]
Changi Airport47.6 °C
Jurong Island45.9 °C
Orchard40.5 °C
Lim Chu Kang36.8 °C
Central catchment33.5 °C
33 °C47 °C and aboveno clear reading
The surface temperatures here are based on the median of thirteen Landsat
overpasses.[^39] There are limitations to this data, though. Indicated in gray are areas
that the passes were unable to capture clearly, perhaps obstructed by clouds, or regions
that fall outside the satellite range, such as the northeastern corner, which includes
Pulau Ubin and Pulau Tekong.
What we can see for sure is that Changi Airport's runways are the hottest surface in the
country at 47.6 °C, with Jurong Island not far behind at 45.9 °C. This ties in
with what we know, the island being reclaimed land, paved and roofed from one end to the
other, and home to much of Singapore's petrochemical industry. Orchard Road also boils at
40.5 °C, 3.7 °C hotter than Lim Chu Kang, which is close to the 4 °C gap
measured between them at street level in Roth’s study, despite being only 30
minutes apart.[^23]
Unsurprisingly, the coolest surface in Singapore is the central catchment forest at
33.5 °C, 14.1 °C lower than Changi Airport's runways, and among the very few
regions yet to be urbanized.
Reconciling the two maps
If you notice any discrepancies between NEA station's live map and the Landsat-based
heatmap, such as why the former's afternoon measurement of Orchard Road sometimes
inclines toward the coolest in Singapore, it's because they're measuring two different
things. Air and land. Furthermore, NEA climate stations are usually located in open,
ventilated ground, far away from other buildings. This makes their thermometers unlikely
to measure temperatures captured within a street surrounded by high-rise buildings, or
an urban environment. In
contrast, satellite readings simply measure whatever surface they capture.
How many years at each temperature
Annual mean
Earlier
Later
The data between 1900 and 1981 was taken from Berkeley Earth,[^3] while the figures
from 1982 onward are retrieved from Changi Climate Station.[^2] There is a discrepancy
of 0.35 °C between them, which means the numbers for 1900–1962 appear lower.
However, it is clear that the top 11 range (27.4 °C to 28.4 °C) are all
clustered from 1963 onward. To be more precise, every reading in the top 11 range
actually comes from 1982 or later, as Singapore became increasingly urbanized.
Synthesis
My read of the data
From 26.7 °C in 1900, the temperature has climbed to 28.1 °C in 2025, after
reaching a height of 28.4 °C the year before. Of note, though, is when Singapore began
its rapid urbanization in 1960, when HDB was first formed and began constructing housing for the
population. Remarkably, the mean temperature remained consistent during that decade, constantly
hovering around 26.7 °C. There are two sharp increases to take note of, such as
26.9 °C in 1966, which if you recall, was when the second five-year program of the Toa
Payoh reclamation began, and 27.1 °C in 1969, which was when it neared its completion
before people moved in on 1970, which was also a high 26.9 °C.
Aside from 1941, 1958 and 1969, where temperatures hit 27.2, 27.1 and 27.1 °C
respectively, Singapore's annual mean never went above 27 °C. That changed from the
mid-1960s onward, when temperatures consistently hovered around the 27 °C mark.
Interestingly, the temperatures remained consistent throughout the 1960s and first half of
the 1970s (though you will notice a clear increase from 1966 onward), despite Singapore's
reclamation and rapid urbanization efforts during that period. I wonder if the heat might
have been mitigated by Greening Singapore, the Garden City program and the annual Tree
Planting Day in 1963, 1967 and 1971, with these early green initiatives bearing some fruit.
By
1977, which was well into the expansion of both Changi Airport and Jurong Industrial Estate,
Singapore's annual mean hit 27 °C — and on the Changi record, which begins in
1982, it has dropped below that mark only twice since (in 1984, when Godzilla returned, and
1989, when Godzilla fought Biollante). As you can see from the table alongside this
section, the annual mean temperature of Singapore only hit 27.4 °C and above from
1963 onward, or more accurately, if you refer to the temperature chart above, from 1982
or later. That's also when Tuas was industrialized, Changi Airport was considerably
expanded, the merger that became Jurong Island began, and the East Coast reclamation
entered its final phases. Before 1982 and the mass urbanization of Singapore, the
annual mean temperature never exceeded 27.2 °C, based on Berkeley Earth. The efforts
of Greening Singapore, the Garden City program and the annual Tree Planting Day might have been
outstripped by the rapid pace of urbanization, the planting of trees no longer able to keep
up with the proliferation of high-rise buildings that replaced much of Singapore's
wilderness.
From the 1990s, temperatures began increasing sharply once more, and though the 1997 high of
28.3 °C is often attributed to the El Niño event that wreaked havoc across the
world and continued into 1998, I'm not sure the surge is completely unrelated to Jurong
Island's reclamation. Indeed, around 2002, when Jurong Island was on the verge of completion
and petrol and fossil fuel companies began occupying it, the temperature shot up to
28.1 °C and slightly dropped to 27.8 °C after its official opening.
In fact, after the 2000s, the temperature has regularly hit 28 °C or above, about
1.1 °C warmer than in 1960. Never mind 1900, over a century ago, in about 60 years, we
went from constantly below 27 °C to frequently above 28 °C. If you feel like
Singapore has gotten hotter recently, it's not your imagination. Between 2008 and 2021, the
number of HDB units grew by 24%,[^16] and the land area increased by 22.9 km².[^5] And that's just
HDB alone, without counting the construction of private estates (e.g. condominiums) and
industrial facilities. During this period, several condominium clusters were constructed in
Pasir Ris Grove, such as NV Residences in 2013, The Palette in 2015, D'Nest in 2017, Coco
Palms in 2018, and even the upcoming Pasir Ris 8 that connects directly with Pasir Ris Mall
and MRT interchange. Further complexes, such as Seastrand in 2014, Ripple Bay in 2015, and
Sea Horizon in 2016, were raised within the same neighborhood. The apparent condominium boom
appears to have very tangible effects on the climate. Accordingly, the annual mean
temperature rose by 0.43 °C. The years hitting 28 °C and above doubled from
4 between 1982 and 2007 to 8 in the next 18 years.
The heat is real.
Projection
The future is looking hot
The annual mean temperatures might appear to fluctuate at first glance, but upon closer
examination, you'll notice a single consistent trend. A trend made visible if you were to
extrapolate it in a single red line. Undoubtedly, temperatures in Singapore have been
consistently rising. Even with fluctuations, they'll rarely diverge from the
shaded band. In other words, by 2035, the annual mean temperature may reach as high as
29 °C while being unlikely to dip below 27.8 °C.
—
warming per decade, on the Changi record[^2]
—
the projected temperature ten years later
—
the range the temperature will most likely fall under
The next century's climate
If we are to extrapolate the line toward the next century, 2100, you'll see that
temperatures are projected to hit 29.9 °C then.
They could be as high as 32.9 °C, or perhaps hover around 28.5, depending on
Meteorological Service Singapore's scenarios, but either way reflect a worrying trend
if nothing major changes. Do take note, though, that this is simply a projection based
on today's +0.22 °C per decade trend, which we then
compared against the range taken from MSS's Third National Climate Change Study. That
study runs climate models under three emission scenarios, their projections based on a
1995–2014 baseline.[^34] This is not a confident prediction
of the future, but just a calculation of where we are headed based on contemporary
data. Our calculations fall in the middle scenario of MSS's, based on our unbending
adherence to a straight line throughout.
Tree angles to consider
Throwing shade
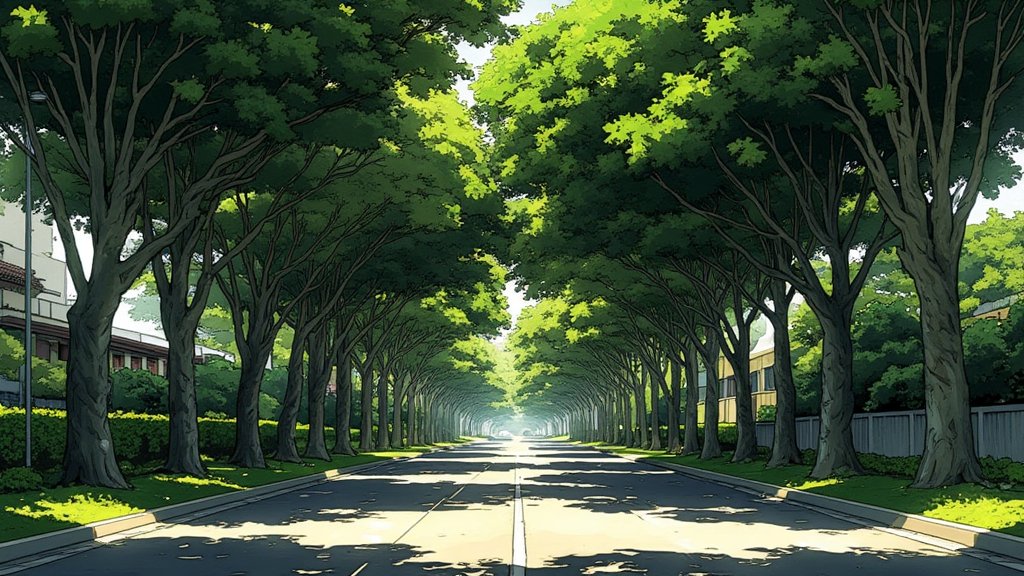
Of course, Singapore isn't sitting around doing nothing as our little island nation heats up
to uncomfortable levels. Urban planners have conducted research, which led them to believe
that shading roads with trees can reduce street-level temperatures by 2.6 °C.
Furthermore, with buildings under tree shade, air conditioning demand will lessen.[^25]
Lei Xu, Ronita Bardhan, Hao Mei, Srilalitha Gopalakrishnan, Xing Zheng and Thomas
Schroepfer's study revealed that street shade does indeed provide effective cooling, with a
decrease of 3.1 °C in Universal Thermal Climate Index, 0.8 °C in air
temperature, 10.0 °C in mean radiant temperature, and a significant reduction in heat
stress severity. They also mentioned other studies where natural shading from trees has been observed to
reduce the Universal Thermal Climate Index by up to 10.3 °C, while overhead shading
devices lower it by 5.3 °C.[^26] Similarly, Puay Yok Tan, Nyuk Hien Wong, Chun Liang Tan, Steve Kardinal
Jusuf, Mei Fen Chang and Zhi Quan Chiam note that vegetation canopy's temperature reduction
composes of 29% evaporation cooling and 71% shade, with an average decrease of
1.7 °C.[^29] Do take note that their measurements were based on potted saplings
instead of trees. In other words, tree shade is an effective way of mitigating heat in
urban Singapore.
Naika Meili, Xing Zheng, Yuya Takane, Ko Nakajima, Kazuki Yamaguchi, Dengkai Chi, Yue Zhu,
Jing Wang, Yeshan Qiu, Athanasios Paschalis, Gabriele Manoli, Paolo Burlando, Puay Yok Tan and
Simone Fatichi noted that trees provided a reduction of air conditioner energy consumption of
8% in Singapore, and up to 12% in Tokyo during summer. However, they also observed that
simply planting more and more trees to get more coverage might not necessarily yield
better effects. The
optimal cover is 40% tree cover, and anything beyond that will lead to a smaller air
conditioner energy consumption reduction.[^27]
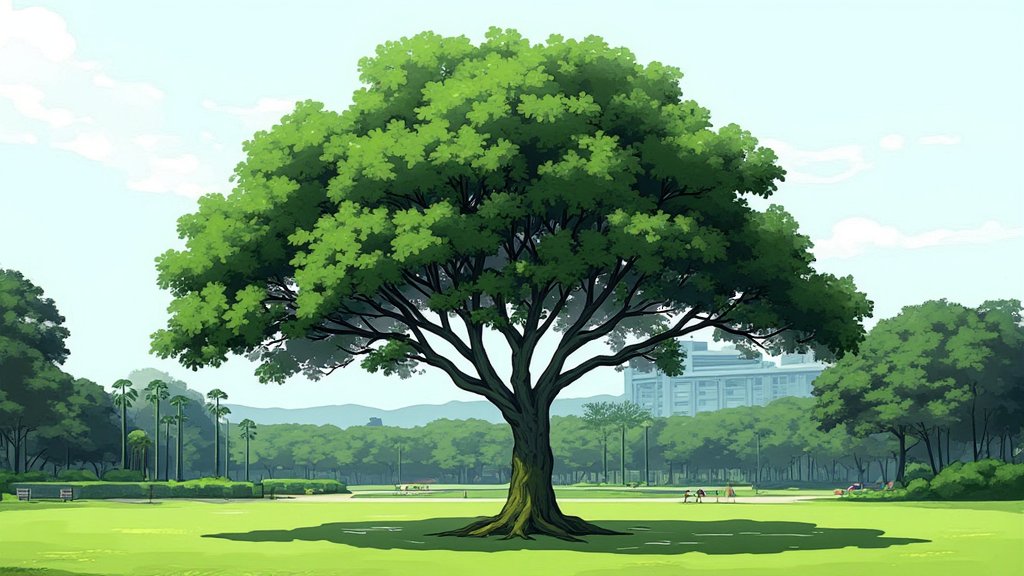
Lai Fern Genevieve Ow and Eugenie Chan observed that the rain tree, with its larger leaf
density, crown area, sap wood area, vessels and rays, was superior to the yellow flame in
providing shade and lowering air temperatures beneath the canopy, making pedestrians feel
less hot outdoors.[^28] If you recall, the rain tree was the sapling Dr. Goh Keng Swee
planted on Mount Faber on the first Tree Planting Day in 1971. Even before that, the rain
tree was among several chosen for their rapid growth and reputations as “instant trees”
when the Garden City campaign was implemented in 1967, which also included the angsana,
sea apple and curtain creeper.[^20] Even today, it remains a reliable choice in guarding
Singapore against climate change.
However, not all scholars agree. Matthias Roth, for example, said that research has not
validated the success of green initiatives, such as planting more trees and developing
rooftop gardens on buildings, in reducing the Urban Heat Island effect.[^23]
Nonetheless, green initiatives should go beyond rooftop gardens and planting trees, and
also encompass a wider range of heat mitigation measures, such as reducing use of fossil
fuels, developing renewable energy sources and increasing energy efficiency. After all,
decreasing heat emission should be just as much a priority as planting more trees for
heat absorption.
Michael Alonzo, Peter Ibsen and Dexter Locke's review included a study that observed how
dry regions were better off favoring shade over the moisture released by trees during
transpiration, and even then, increased tree canopy was only effective at cooling the air
in hotter and drier Southern Europe.
Worse, in extreme, tropical humid conditions like Singapore, it appeared that increased
tree canopy might have only a negligible impact on cooling, though they acknowledged more
studies are required in this climate zone.[^32] In other words, while preserving our
greenery is a priority, we should not be overly optimistic about its immediate effects.
Forest areaLoading…
This chart covers the forest area in Singapore, measured by the Food and Agriculture
Organization of the United Nations (FAO) and published by the World Bank.[^45] Take
note that FAO only has data for 1990, 2000, 2010, 2015 and 2020. The other years are
simply a rough interpolation, and not an actual measurement. Contrary to expectations,
it appears that Singapore’s forest area increased from 148.3 km² in 1990 to
170.1 km² in 2000 before peaking at 177.4 km² in 2010. However, given the
decline of forest area to 164.7 km² in 2015 and 155.7 km² in 2020, I don’t
think it’s a coincidence that this is within the same period where the annual mean
temperature rose by 0.43 °C, and that 2016 and 2019 were the hottest years on
record (28.4 °C). As forest area fell from 2010, four years within that decade
reached 28 °C or above, equaling the four that hit the same threshold between
1982 and 2007. And we haven’t counted the data on 2021 and after, given that we
have no actual measurements of forest area then.
Happy Tree Friends
The cool trees on the block
So what would be the best trees to plant to help mitigate rising temperatures? Here’s a
list of trees that are great at providing comfort from the heat.
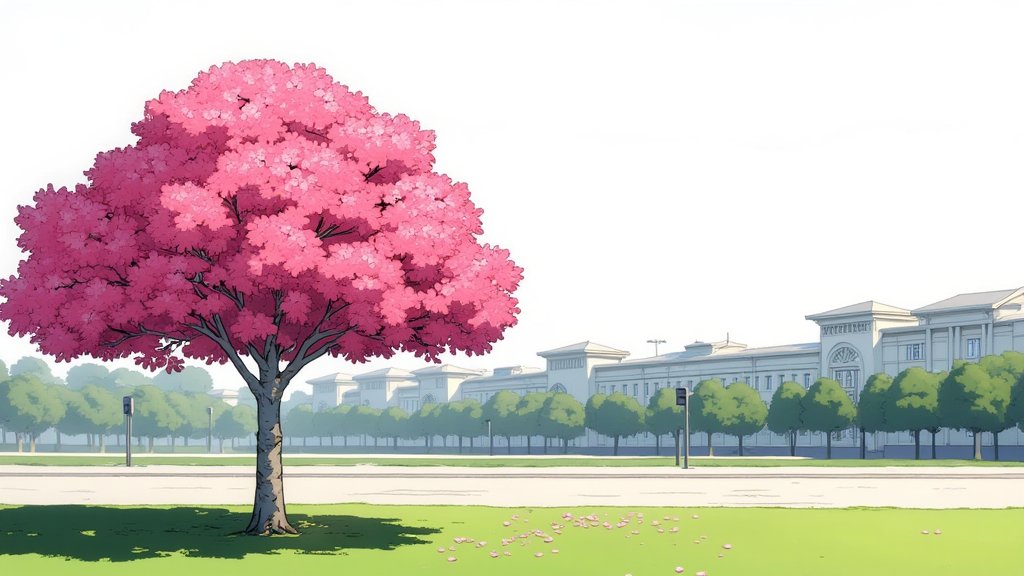
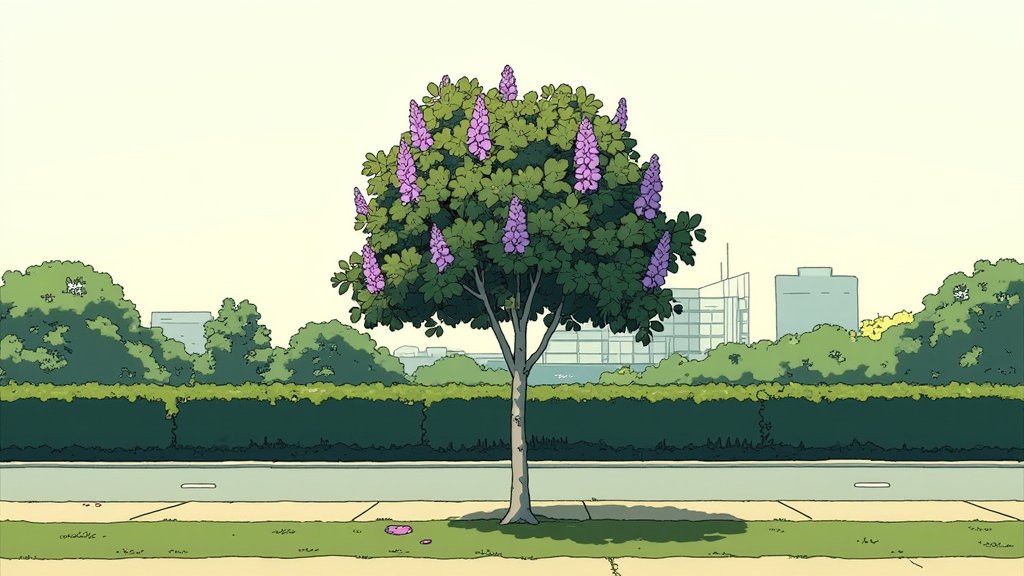
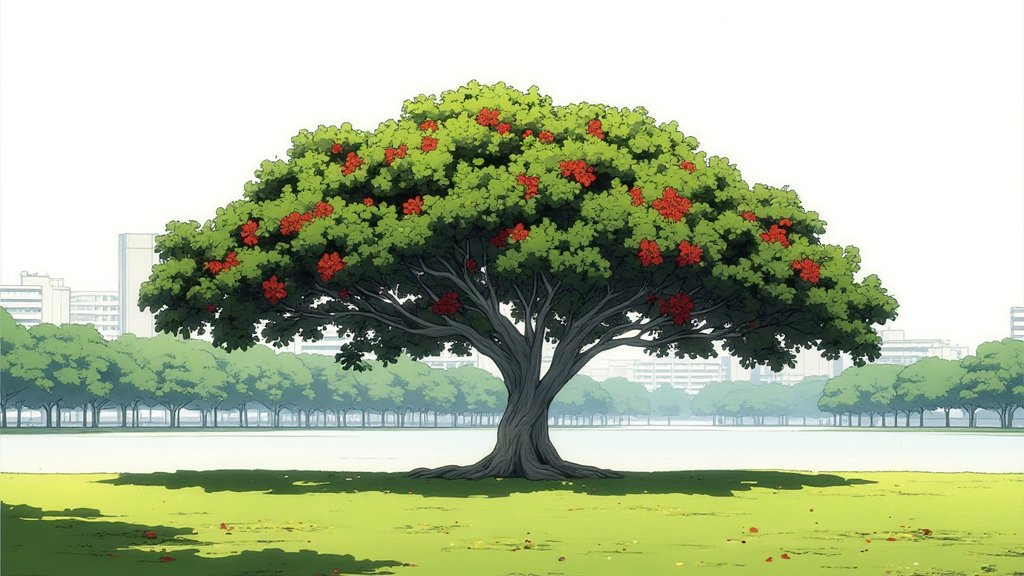
Rain treeSamanea samanWith large leaf density, crown area, sapwood area, vessels and rays, the aptly named rain tree provides significant shade and reduces air temperature under its canopy.[^28] If you recall, the now ubiquitous rain tree was also one of the “instant trees” planted during the Garden City campaign in 1967.Trumpet treeTabebuia roseaAs a seasonally dry forest tree, it has the potential to grow rapidly and have high rates of transpiration in a humid environment such as Singapore. With higher stomatal conductance and wider vessels in the xylem, larger potential for sap-flow, its higher transpiration rate will lead to greater evaporative cooling potential.[^47]Pride of IndiaLagerstroemia speciosaBelonging to the seasonally dry forest group, like the trumpet tree, it has a higher transpiration rate during cloudy conditions, and thus greater evaporative cooling potential.Flame of the forestDelonix regiaAlso belonging to the seasonally dry forest group, like the trumpet tree and pride of India, it is included here because of its potentially high transpiration rate and evaporative cooling. Furthermore, it is more tolerant of drought than evergreen species, such as yellow flame.[^47]Brazilian ironwoodCaesalpinia ferreaBelonging to the seasonally dry forest group, it displayed high transpiration and heat transfer rates under sunny conditions, which makes it good for cooling in Singapore on such cloudless days.[^47]North Indian rosewoodDalbergia sissooPart of the seasonally dry forest group, it also has high transpiration and heat transfer rates under sunny conditions, which also makes it great for providing residents relief from heat when there are no clouds.[^47]
What transpired during my research
Despite Tan et al.’s hypothesis that higher transpiration rates have larger evaporative
cooling potential in their research comparing seasonally dry forests against aseasonal
evergreen forests,[^47] other studies observed that this might not necessarily be the
case. For example, Ow and Chan’s comparison between the rain tree and yellow flame
(Peltophorum pterocarpum) revealed that while the latter has a higher
transpiration rate, it was less effective at cooling than the former,[^28] because shade
was the greater contributor to reducing heat (71% shade, 29% transpiration, see
above).[^29]
This is supported by Li et al., who found that in a tropical place like Singapore, the
island’s high humidity reduces the cooling efficacy of urban trees’ transpiration. In
fact, they found that in countries with a humid climate, excessively planted trees or
those planted in enclosed spaces would result in low cooling efficacy or thermal
discomfort, and might even raise the perceived temperature by up to 2 °C.[^48]
If you’ve been searching around local websites like me, you might have stumbled upon a
webpage, Green Garden, which claimed that “native trees like Rain Tree, Angsana, Sea
Apple, and Tembusu are perfect” for providing shade and cooling Singapore.[^49] But my
own research couldn’t find evidence to prove that. In the first place, the rain tree is
not native to Singapore. It is believed to be native to South America,
specifically Colombia, the Caribbean slope and Orinoco drainage of Venezuela, as well as
Central America.[^50]
Teo, Yu and Luo compared the tembusu against eight other trees in Singapore, and found it
was among the most temperature-sensitive, its photosynthetic capacity falling by nearly
50% over a 5 °C increase.[^51] What does photosynthesis have to do with cooling, you may
ask. Well, it’s directly related to transpiration. So if the tembusu photosynthesizes
less, it transpires less. This is because leaves open the same stomata to absorb carbon
dioxide and release water vapor. So if fewer of the tembusu’s stomata are open when
photosynthesizing, it also means less water vapor is released. And when transpiration
falls, so does its cooling efficiency.
Compared to the rain tree and mahogany in Bandung, Indonesia, the angsana had the lowest
cooling efficiency, reducing air temperature by only 2.28 °C. For reference, the rain
tree scored 3.8 °C and the mahogany 3.1 °C. The angsana also had the lowest humidity
increase under its canopy (again, the rain tree scored the highest), which also speaks
about a lower transpiration rate. The angsana has a higher average canopy area than
mahogany, though, with around 223.55 m² compared to the latter’s 108.45. Once again, the
rain tree triumphs with a 513.44 m² average canopy area.[^53] Not exactly
confidence-instilling for the angsana. As for sea apples, they are, in fact, being
replaced by NParks because they have been observed to be susceptible to basal rot.[^52]
So they’re being removed before they start falling over and becoming a hazard to
residents.
A shady simulation
The trees have us covered...or do they?
Based on the data Claude and I gathered, we built a mathematical model that calculates how
much air conditioner energy we can save in proportion to tree cover. As mentioned in Meili,
et al's findings, once you have more than 40% cover, the air conditioner energy savings
begin to slow drastically. Apparently, that many trees will add so much humidity it begins
to tax the air conditioners instead.
0%20%40%60%80%
Tree height, against the buildings
The street itself
−16%
summer air-conditioning energy, against the same street with no trees at all
What do these numbers mean? Meili, et al obtained data for Singapore at 40% cover, which
they then averaged across every type of street. This translates to 5.92 million people,
living in roughly 15 m² homes each, saving 2.39 kWh per m² per year, assuming
their electric bill costs SG$0.32 and 0.41 kg of CO₂ per kWh. This totals
SG$68 million and 87,000 tons of CO₂ a year, and that's before taking into
consideration the CO₂ these trees will absorb. Meili, et al simulated five different
cover percentages (0%, 20%, 40%, 60% and 80%), but they acknowledge that their
ventilation test might affect results. E.g. a building with lots of ventilation halves
the energy savings, whereas a sealed structure gains about 25% more savings. They also
calculated based on the average across a whole street, rather than a single tree outside
a specific building.[^27]
In contrast, Chen Yang, Mengju Xie and Thushini Mendis's review calculated that energy
savings in equatorial climates can reach up to 31.75%, which is almost double Meili, et
al's data, but they measure the shade provided by a single tree planted three to five
meters away from a wall.[^31] Shamila Haddad's team, studying Riyadh with a different
model at a different university, only calculated 13.4% energy savings from irrigated
tree cover across 3,323 buildings in the Al Masiaf district,[^33] instead of the 17%
obtained by Meili's team for the same city. Do take note these values differ from the
simulator because it calculates Singapore's streets, which average 8%, and not 17%.
On the other hand, Alonzo, Ibsen and Locke corroborate the 40% cover, their own
studies placing the optimal cooling within a canopy threshold of 35 to 50%.[^32] The
takeaway, then, is yes, planting more trees will help mitigate the Urban Heat Island
Effect, but only to a certain extent. The solution isn't as simple as planting more
trees. We need to plant more trees, ensure we're not excessive about it (or the extra
humidity might create new problems), and consider other options.
After all, combating climate change isn't growing greenery to absorb the heat alone. I am
not naive enough to believe we should simply stop urbanization, nor am I delusional enough
to demand we demolish buildings and replace concrete with jungle. We have already gone
past the point of no return, and like it or not, urbanization is inevitable, and more
buildings will be constructed in Singapore as we progress into the future. That is the
nature of civilization. The government might acknowledge the climate crisis, but they also
have to consider the needs of the population, whether housing, financial well-being (in
the form of employment), health and infrastructure (both digital and industrial). There is
no going back to some idealized, romanticized world of nature free of industry and
technology. Rather, I suggest that even as we continue to urbanize, we take measures to
mitigate the climate changes that arise with it, whether in the form of developing more
efficient energy systems, using nature-friendly materials, pioneering environmental
engineering techniques or combining urbanization with reforestation. That is to say,
ensuring there is abundant space for planting trees even in new, modern urban districts.
We also need to cut down on carbon emissions, whether it is switching to clean energy or
electric cars. However, even if we use electric cars, the power we use shouldn't be
generated from burning gas, otherwise we're back to square one. That means looking into
how we could produce our energy.
The nuclear option
Running low on gas
In 2024, Singapore's fuel mix for electricity generation consisted of natural gas (94%),
solar (2.1%), coal and petroleum (1.2%) and other energy products, such as municipal
waste, biomass and imports (2.7%). The percentage of natural gas dropped to 93.1% in the
first half of 2025, while solar rose to 2.5%.[^35] Electricity is generated by burning
gas, which leads to high carbon emission, resulting in rising temperatures.
Given my history with studying Japanese history (that was on purpose), which included
Godzilla, the atomic bombs in World War II, the proliferation of nuclear reactors across
postwar Japan, and eventually the 2011 Fukushima disaster, I can't say I'm an advocate of
nuclear technology. However, I am less of a fan of relying on fossil fuels for power,
especially when confronted with the challenge of climate change, so I thought I should
cautiously consider calculating the option. Regardless of my personal reticence,
Singapore is looking into nuclear energy. Current Prime Minister Lawrence Wong said in
his Budget 2025 speech in February that year that the government will study the potential
deployment of nuclear power in Singapore. Later that year, in September, the Energy Market
Authority commissioned Mott MacDonald to conduct a safety and technical feasibility study
on advanced nuclear energy technologies, such as small modular reactors.[^37] On
1 March 2026, EMA signed a Memorandum of Understanding with Korea Hydro and Nuclear Power
Co Ltd on civil nuclear energy cooperation, as part of exploring how Singapore can
decarbonize our power system and ensure reliable, secure and sustainable energy
supply.[^38]
0102030405060708090100%
—
million tons of CO₂ a year that stop being emitted[^35]
The difference in heat boils down to efficiency. While nuclear reactors are capable of
generating far more power than their gas counterparts, their thermal efficiency is
33–37% in light water reactors, though the latest pressurized water reactors can hit
38%.[^36] In contrast, our current gas-powered electricity generation is roughly 50%,
with a gross output of 60 TWh from a 123 TWh input in 2024, and 30 TWh
from 60 TWh in the first half of 2025. Also note that in 2024, the carbon emission
stood at 0.402 kg CO₂ per kWh.[^35]
Heated absence
Instead of calculating temperatures (trust me, I tried, but Claude Code advised against
it), this model is framed around carbon emissions instead. We don't have the data to
calculate how much impact switching to nuclear energy would have on Urban Heat Island
effect or Singapore's annual mean temperature. Furthermore, the excess in waste heat
emitted by nuclear reactors would point the other way, anyway. However, we do have data
on how much carbon emissions nuclear energy can reduce, and given that decarbonization
is a global effort and that carbon dioxide, a greenhouse gas, is one of the major
causes of rising temperatures, I feel tackling the root of climate change is worth
exploring.
Takeaways
Too long, didn’t read?
If you skipped to this section because you found me longwinded, and wanted me to get
straight to the point, well, here’s the short version.
Singapore is hot!
Ever since Singapore began reclaiming and large-scale urbanization in the 1960s, the
annual mean temperatures have been regularly hovering near 27 °C,[^3] and it started
hitting 27.4 °C and above from 1982,[^2] when our country’s modernization went into full
swing.
Planting a seed of skepticism
While most professionals would recommend planting more trees to reduce urban heat,
and they are correct, there is a caveat. Firstly, there is little cooling benefit to
exceeding 40% tree cover, as the humidity created from excessive transpiration may
backfire.[^27] Secondly, despite the longstanding species that have taken root in
Singapore since the 1960s, by virtue of Greening Singapore, the Garden City program
and Tree Planting Day, some trees are better at cooling than the others.[^47] Worse, a
couple of those species even ended up proving susceptible to basal rot.[^52]
Looking at you, rain tree.[^28]
Reacting to small modular reactors
Though there is an advantage in switching from fossil fuel-based electricity to
nuclear power, the greatest of which is a stark reduction in carbon emissions (and
thus contributing to the war against climate change),[^35] the larger waste heat produced
means that even as we contribute globally to protecting the climate, Singapore
doesn’t get cooled as effectively.[^36]
Disclaimer
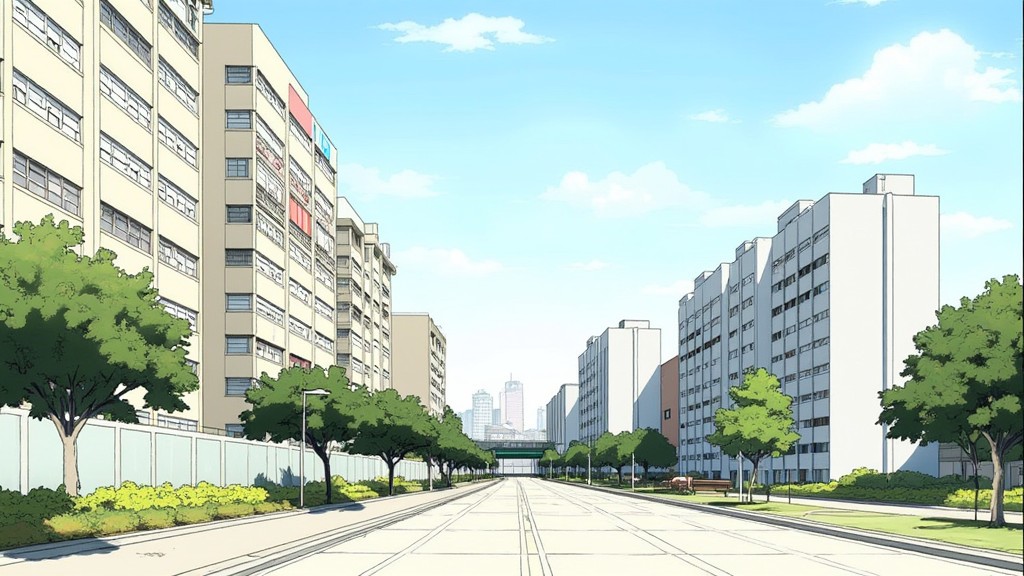
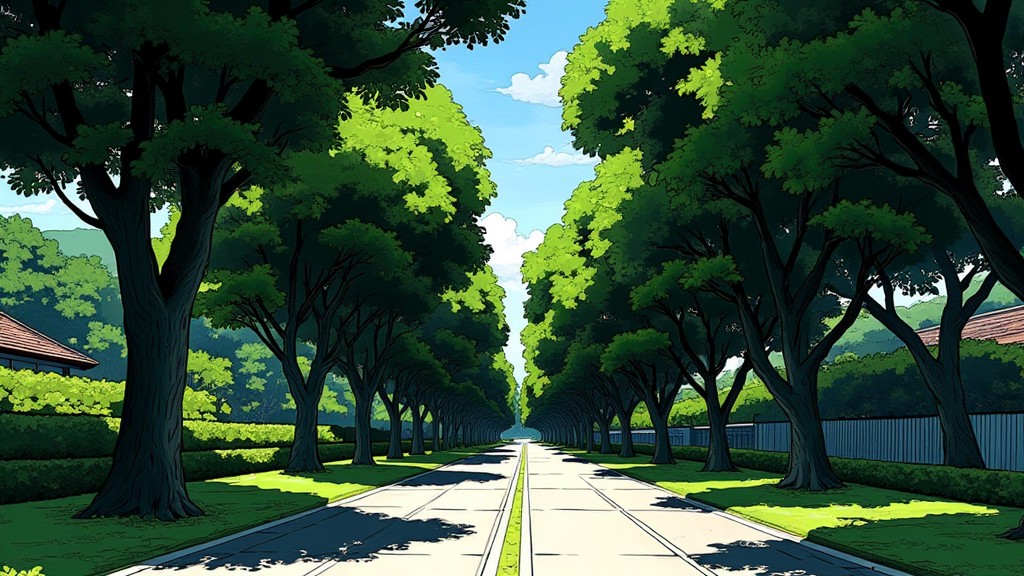
The artwork isn't real
To avoid getting into copyright trouble, I decided not to copy historical photographs from
National Archives of Singapore, National Library Board, etc., and instead generated the
illustrations using my self-built webcomic MCP ecosystem. I used three of my MCP servers:
webcomic background generator,
character and panel generator, and
anime production generator (which created
the video you see above, albeit not very well done).
As such, my illustrations should be read as interpretations of documented backgrounds, and
not an accurate visual representation of historical reality.
Also, I thought it was a good chance to put something I built with my buddy, Claude Code, to
use, and demonstrate the fruits of our webcomic labor.
Footnotes
References
Where relevant, I have left Claude's notes as they are, because they surprisingly provide
valuable insights on how to read the data. This is not to say Claude did all the research.
I sourced most of them. Plenty of Claude's online sources were dead links or locked behind
paywalls, so I had to do some manual digging. Of course, I read them myself (even if I
didn't quite understand the more technical and scientific articles). I only fed them to
Claude afterward to give him context and to ensure my read of the articles was right
(especially when interpreting numerical data), not to ask him to read for me. Nonetheless,
I think this is evidence that AI and humans can work well together.
National Environment Agency. “Surface Air Temperature.” Data.gov.sg. Five datasets, Changi Climate Station, January 1982 onward: “Monthly Mean”; “Annual Mean Daily Maximum”; “Annual Mean Daily Minimum”; “Monthly Absolute Extreme Maximum”; “Monthly Absolute Extreme Minimum.” Accessed August 14, 2026.
The annual mean and the annual hottest and coldest readings are derived here from the monthly series, complete twelve-month years only; MSS does not publish them. 1997 and 2015 both land on exactly 28.25 °C, so this page shows 28.3 where MSS’s table shows 28.2. The ten warmest years are the same either way.
Berkeley Earth. “Singapore: Regional Average Temperature.” singapore-TAVG-Trend.txt. https://berkeleyearth.org/data/. Accessed August 14, 2026.
National Environment Agency. “Real-Time Air Temperature API.” Data.gov.sg. https://api-open.data.gov.sg/v2/real-time/api/air-temperature. Accessed August 14, 2026.
National Library Board. “Marina Barrage.”Singapore Infopedia. Accessed August 14, 2026.
Housing & Development Board. “Dwelling Units under HDB’s Management, by Town and Flat Type.” Data.gov.sg. Accessed August 16, 2026.
Analysis by the author, not a citation. Counts are as at 31 March of each financial year and cover sold and rental units together. Summed across every town and flat type, the stock under HDB’s management goes from 883,896 units in FY2008 to 1,096,380 in FY2021 — a rise of 24.0%.
National Parks Board. “OneMillionTrees Movement.” Trees.sg. Accessed August 14, 2026.
The count is a live counter on that page. It read 887,044 in August 2026 and will have moved since.
National Environment Agency. “Historical Air Temperature across Singapore (2023).” Data.gov.sg. Accessed August 15, 2026.
Analysis by the author, not a citation. 6,893,129 per-minute readings across 17 stations, grouped by timestamp; scripts and full distributions are kept with the project research notes so the figures re-run from the raw file.
Centre for Climate Research Singapore. “Climate Change Projections for Singapore.” Chap. 5 in Singapore’s Third National Climate Change Study (V3): Stakeholder Report. Meteorological Service Singapore, 2024.
Table 5.1 gives the annual average daily mean air temperature over 2080–2099 as the mean of five models, with the model minimum and maximum in brackets: 29.0 (28.5–29.5) under SSP1-2.6, 29.9 (29.3–30.7) under SSP2-4.5, and 31.7 (30.7–32.9) under SSP5-8.5, against 27.9 °C observed at the current nine stations. The 28.5 and 32.9 above are the outer bounds of that set. Note this is the annual mean: MSS’s online visualiser defaults to a seasonal daily maximum, which is a different and much higher figure.
Energy and Emissions
Energy Market Authority. “Energy Transformation.”Singapore Energy Statistics, chap. 2. Accessed August 16, 2026.
Aurecon Singapore. “EIA at Sunset Way: EIA Report.” Rev. 6. Commissioned by the National Parks Board on behalf of the Housing & Development Board, July 1, 2026.
World Bank. “Forest Area (sq. km) — Singapore.” World Development Indicators, drawing on the Food and Agriculture Organization’s Global Forest Resources Assessment. Accessed August 17, 2026.
Staples, George W., and Craig R. Elevitch. “Samanea saman (Rain Tree).” In Traditional Trees of Pacific Islands: Their Culture, Environment, and Use, edited by Craig R. Elevitch. Hōlualoa, HI: Permanent Agriculture Resources, 2006.